What you'll find on the Dashboard
After you log in to Foxdeli, you land on the main page, the Dashboard. It works like a “noticeboard” that instantly gives you an up-to-date overview of the figures you track, such as the number of orders, clicks back to your e-shop, the number of undelivered shipments or the latest orders with issues. Below, we go through the individual blocks and explain the abbreviations.
👀You'll find a more detailed overview of all events, split into a general overview, Rating, Mailing and Tracking page, in Analytics.
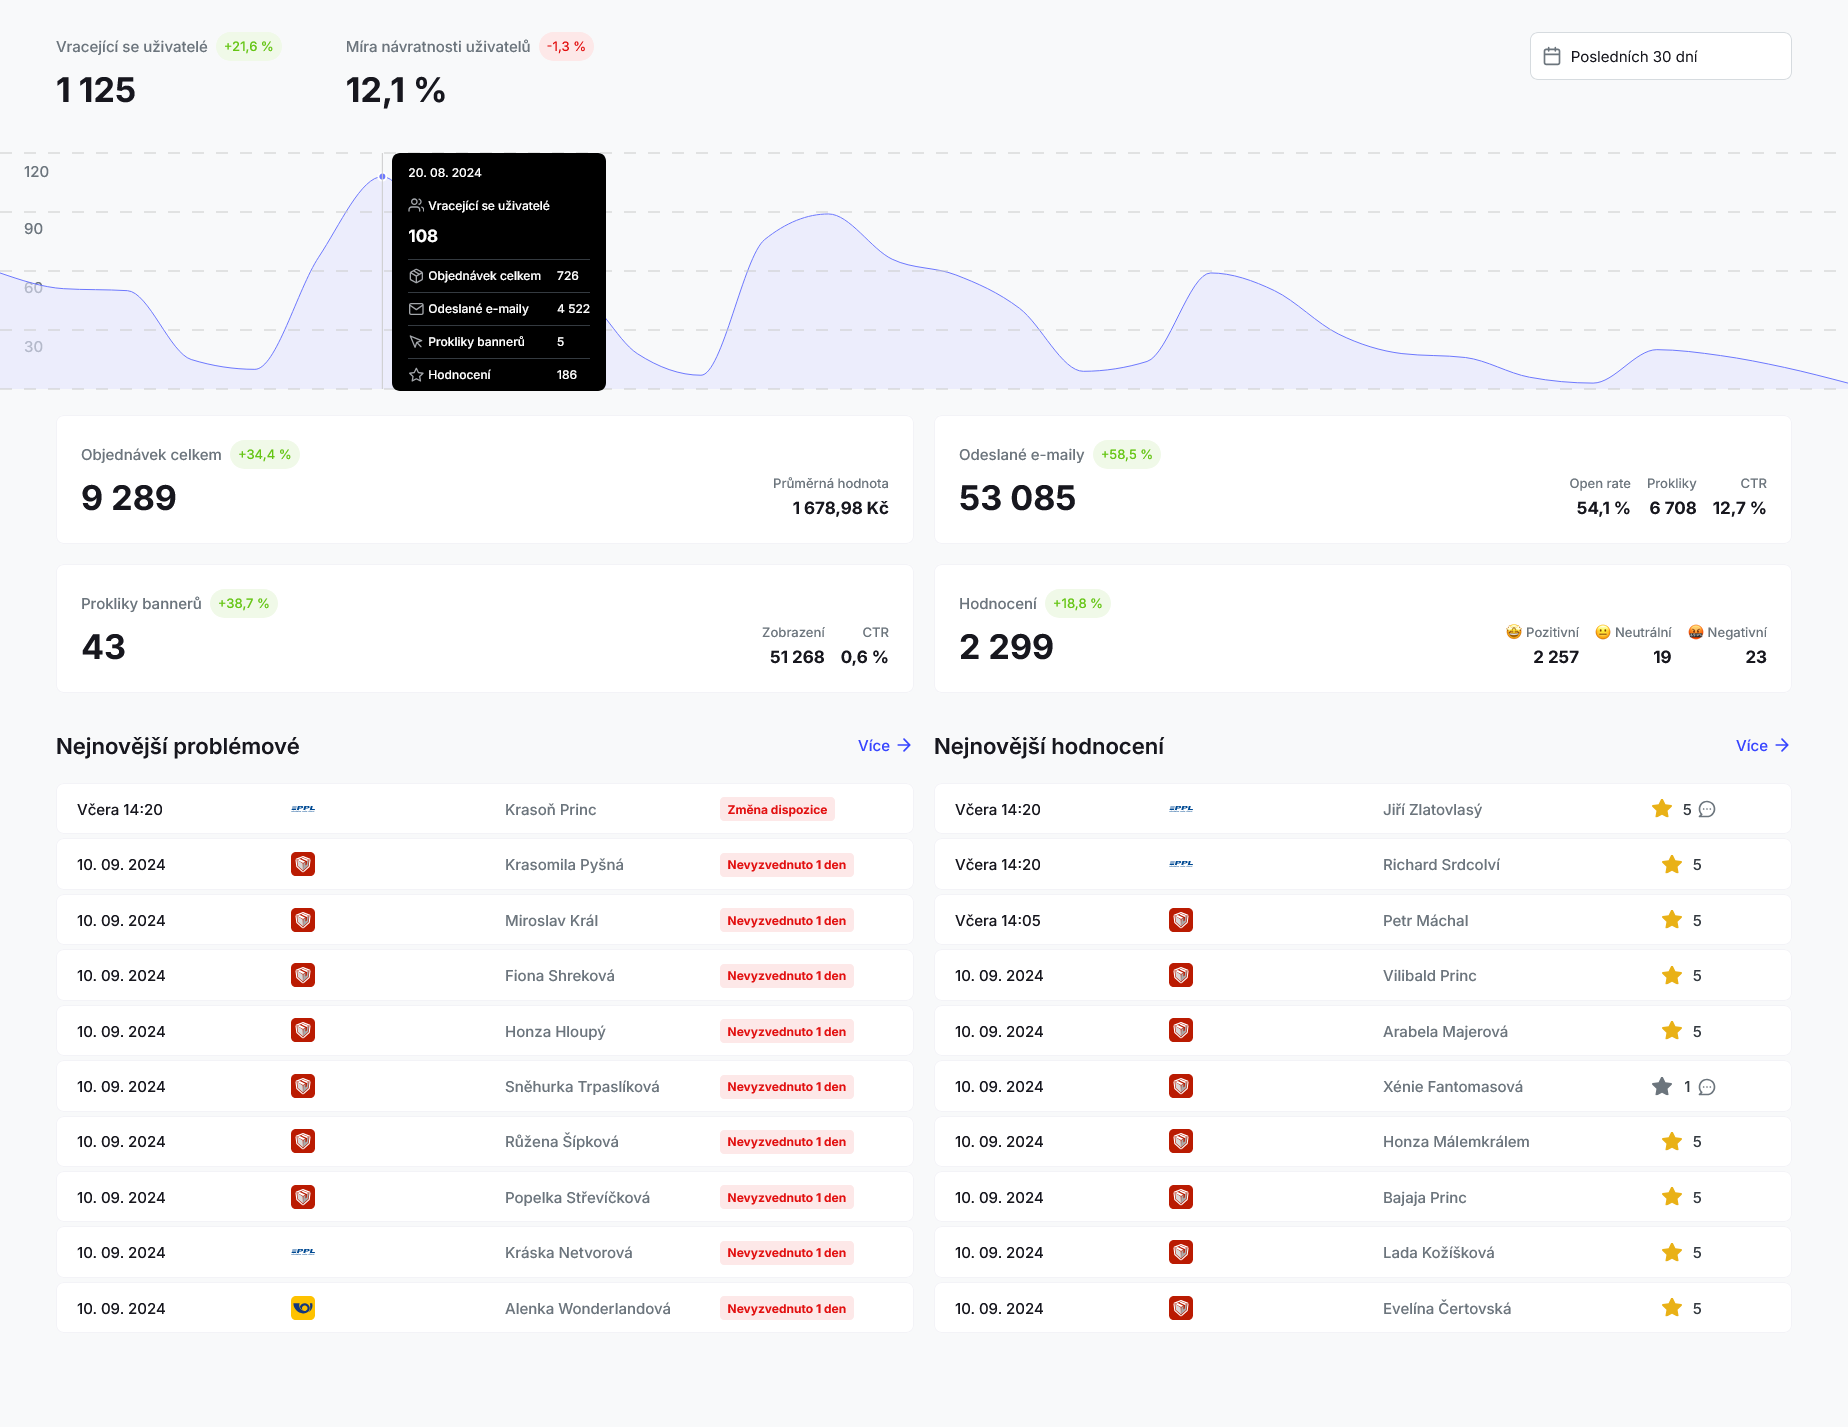
When you hover over the chart, key information is shown for each specific day.
The figures for the same metrics are also shown below in individual tiles. By default they cover the last 30 days; you can change the period using the calendar in the top right corner.
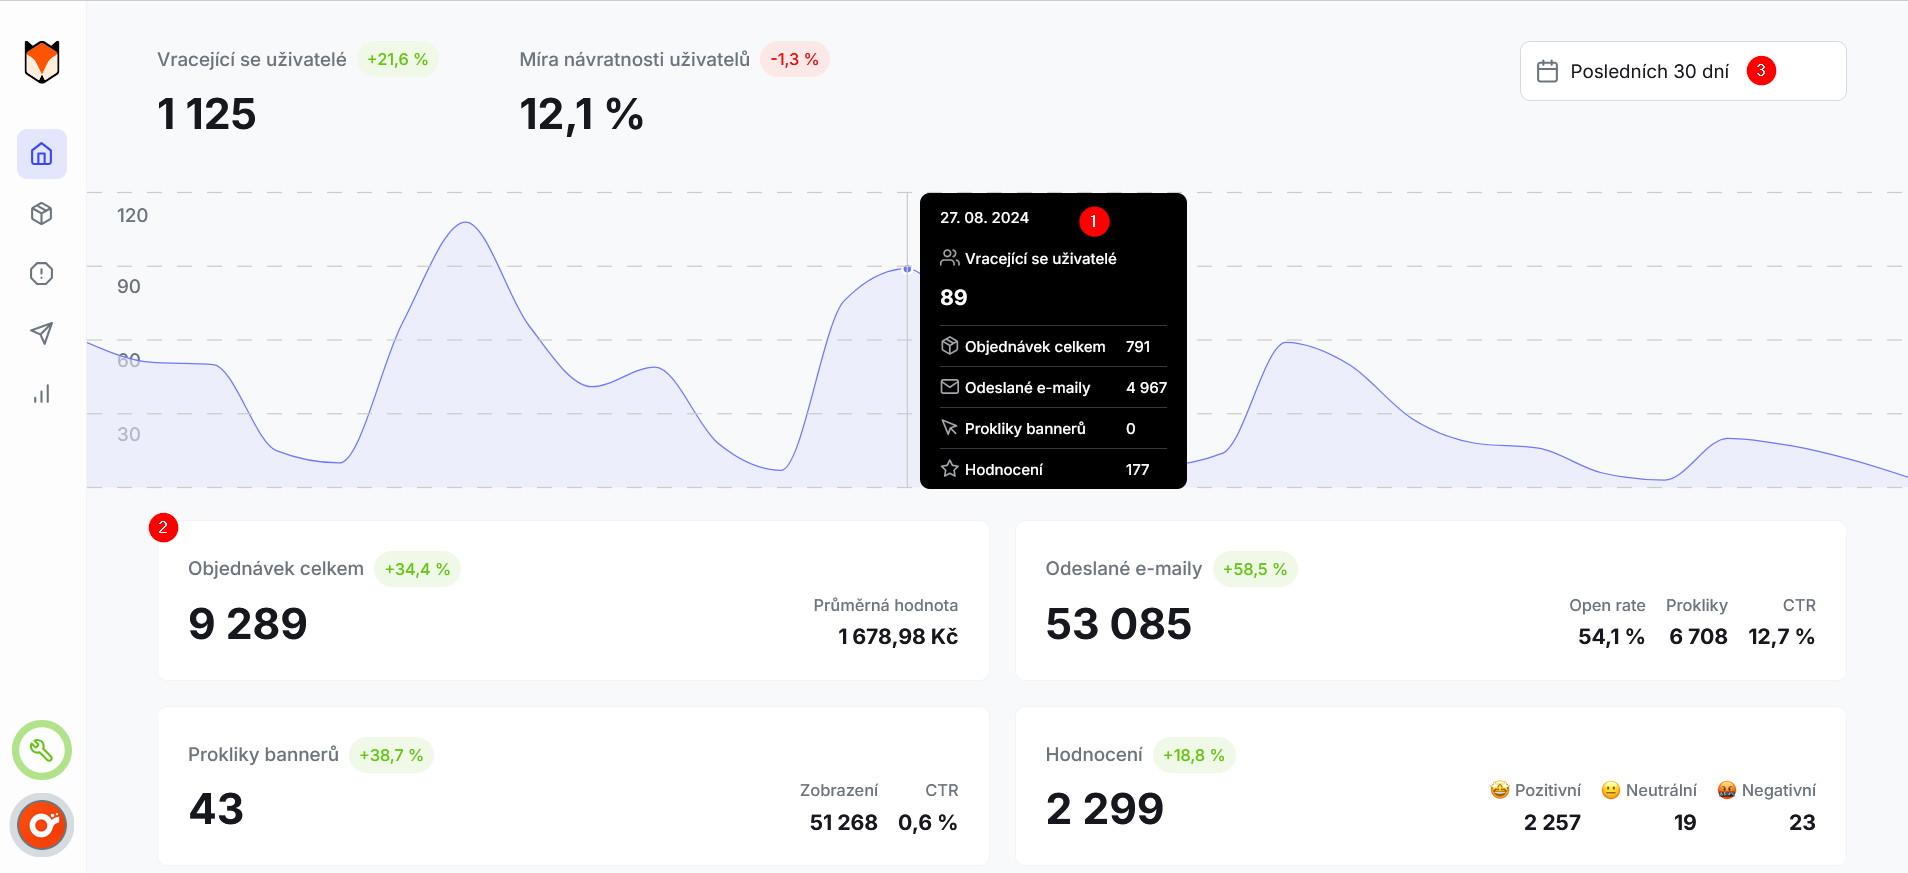
From the tiles in each area you can click through to the rest of the app: hover over a tile and a “More” button appears.

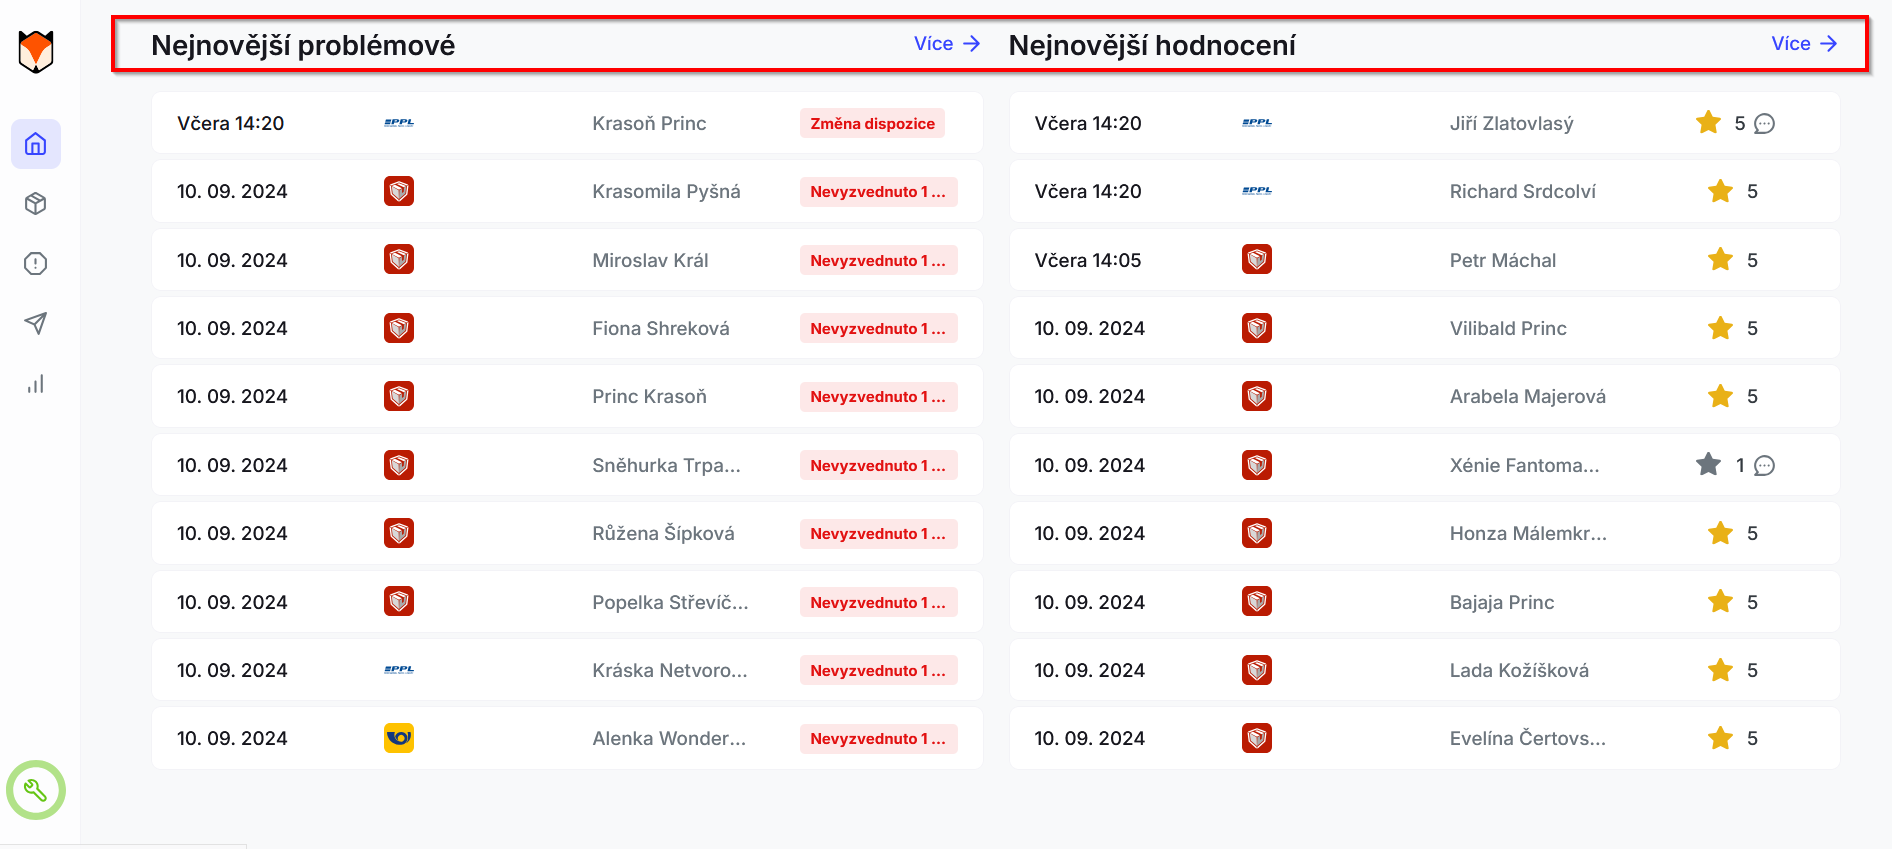
At the bottom of the Dashboard, you'll see the latest orders with issues (“Latest issues”) and the latest ratings (“Latest reviews”, covering both delivery and the e-shop). Again, the “More” button takes you straight to the relevant section.
Still have questions?
Contact usMore articles in this category
- Brick-and-mortar pickup places for personal pickup
- Delayed due to carrier time constraints – a workflow status
- E-mails and SMS in the order timeline
- How to turn on e-mail communication: working with Workflow
- Order Issues
- Undelivered message alerts
- Withdrawal from contract – button in delivery e-mails
- UTM parameters in links
- Connecting your e-shop to Foxdeli – Shoptet module
- Connecting your e-shop to Foxdeli – Shopify app
- Getting started with Foxdeli
Articles in this category
- Brick-and-mortar pickup places for personal pickup
- Delayed due to carrier time constraints – a workflow status
- E-mails and SMS in the order timeline
- How to turn on e-mail communication: working with Workflow
- Order Issues
- Undelivered message alerts
- Withdrawal from contract – button in delivery e-mails
- UTM parameters in links
- Connecting your e-shop to Foxdeli – Shoptet module
- Connecting your e-shop to Foxdeli – Shopify app
- Getting started with Foxdeli